
Field foliage–you can’t escape it!
It’s summer, and here in Massachusetts that means plants. Look up on a hike and you’ll be hard-pressed to find any patches of blue between the thick tree canopy. Every street seems to have a farm stand overflowing with produce. And I’ve heard plenty of jokes about needing to lock houses and cars, not to keep out unwanted people, but to avoid vegetation taking up root in them. It’s always interesting to learn about the native vegetation wherever I go, and often necessary to take the flora into account when preparing for a day in the field.
Vegetation and geology are more closely related than you might think. On Mars, the lack of a concealing canopy of trees makes it easy to measure geologic surface features, but the absence of plants leads to significant differences in the shapes of features like rivers, which on Earth rely on plants to hold their banks together. Our photosynthesizing plants have even changed the chemistry of Earth’s atmosphere, which before the development of plants consisted mostly of carbon dioxide, sulfur, and methane. Vegetation is an important factor in the stability of beaches and marshes, hillslope erosion, and water chemistry, just to name a few things. But nowhere is this connection more obvious than when doing fieldwork, from chopping our way through dense thickets in Virginia with the Buckmarlson Banshees to pulling cactus spines out of my shoes, legs, and backpack in Texas. And on my last field trip to Washington, we were able to spot patches of basalt bedrock from far away by looking for the weedy red grass that prefers to grow in that rock. All of this begs the question…how do you measure something like vegetation?
The answer is…depends what you’re trying to find out. On smaller scales, one might be interested in the plant density to calculate water infiltration rates, root depth as a proxy for soil competence, or biodiversity to indicate ecosystem health. If your study area is a fairly uniform environment, like a single meadow or watershed, you can do what this Oregon State University research group is doing and use a quadrat.

OSU students using a quadrat to measure biomass
This simple square frames out a representative area, allowing researchers to obtain the biomass, species distribution, percent coverage, or just about anything else you’d want to know about this small patch, and then extrapolate it to the size of the area it represents. Perfect! But what if I wanted to compare these factors between some of my field sites, which are scattered all over the country?
To compare vegetation in distinct regions, or to find an average over a large area, we have to turn to remote sensing. NOAA’s Advanced Very High Resolution Radiometer (AVHRR) is one of several space-based instruments currently measuring vegetation quality and quantity around the globe. This instrument measures the wavelengths of sunlight that bounces off the earth, and is especially sensitive to the wavelengths reflected by healthy plants (0.4 to 0.7 microns). Its measurements are taken 1 km apart, and each point on earth gets re-measured every 1-2 weeks, providing a wealth of information about ever-changing conditions such as drought extent, fire damage, crop yields, and even illegal logging.
Each one of these measurements returns a spectrum, or a distribution of the intensity of reflected light over a range of wavelengths. To use these numbers in a meaningful way, remote sensing experts have created indices that relate the reflected light waves to qualities of vegetation. Healthy, lush plants absorb all visible light waves except green (which gets reflective, and is why plant leaves look nice and green to our eyes), while unhealthy plants and bare ground reflect more of the visible light colors and look brown. Happy plants also reflect a lot of the near-infrared light that comes in from the sun, while unhappy plants absorb a larger fraction of these wavelengths.

Plants reflect light differently based on whether or not they are actively photosynthesizing. Image from NASA’s Earth Observatory
The NDVI, or Normalized Difference Vegetation Index, uses both of these tendencies to calculate a quantitative vegetation score for any plant area. Here’s the formula:
NDVI = (NIR — VIS)/(NIR + VIS)
A plant with no green leaves will score about 0 on the NDVI. Other factors, such as evapotranspiration rates, incoming sunlight, and human population density certainly influence (and/or are influenced by) the degree of vegetation in a region, and these global data sets allow researchers to correlate these factors over wide areas.

NDVI of North America from AVHRR composite imagery. Image from NASA’s Earth Observatory
Looking at this map of the nationwide NDVI, it’s obvious that the east coast is the place to be a plant. We have just enough sunlight, and plenty of water to go around. The variability in precipitation, temperature, soil type, and lots of other factors between my field sites is reflected in a wide range of NDVI values. Here are just a couple; how do you think your hometown compares with its NDVI value?
 Craters of the Moon, ID: NDVI = 0.2 Craters of the Moon, ID: NDVI = 0.2
Most of the green stuff growing on these basalt lava flows are lichens, which break down rock into soil and allow larger plants to eventually colonize |
 Carrizo Plain, CA: NDVI = 0.3 Carrizo Plain, CA: NDVI = 0.3
Not much grows in this dry region of south-central California for most of the year, but some bushes can tough it out in gullies, where their roots are closer to groundwater |
 Yosemite, CA: NDVI = 0.3 Yosemite, CA: NDVI = 0.3
A decent annual precipitation can support a beautiful evergreen community, but the vegetation cover is limited by the soil availability on these steep, glacially-eroded surfaces |
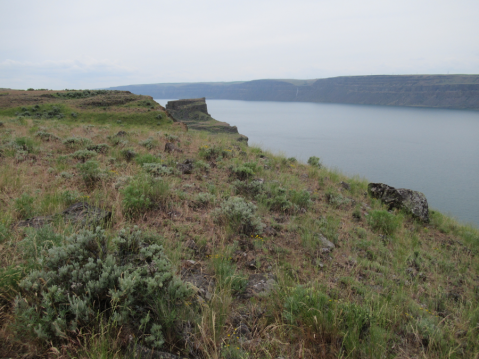 Grand Coulee, WA: NDVI = 0.2 Grand Coulee, WA: NDVI = 0.2
Plenty of sun here, but low precipitation makes for patchy shrubs and grass only. The water held in the Banks Lake reservoir off to the right is used to irrigate the rich glacial soil, allowing farming in otherwise unusable land |
 Multnomah Falls, OR: NDVI = 0.6 Multnomah Falls, OR: NDVI = 0.6
About 3 hours west of Grand Coulee the landscape changes dramatically; water precipitates on the coastal side of the Cascades, resulting in thriving plant communities (and gorgeous waterfalls!) (photo by Mike Larsen) |
 Howardsville, VA: NDVI = 0.8 Howardsville, VA: NDVI = 0.8
The thick vegetation cover in the Virginia Piedmont is quite effective at weathering the old basement rock…it can be quite a challenge sometimes to see the rock through the plants! |

Devils Tower, WY: NDVI = 0.4 The moderate vegetation cover includes species from both coasts; you can find both western ponderosa pines and eastern oak trees at our first National Monument |
|

Trackbacks / Pingbacks